The purpose of this guide is to introduce you to working with Visual Paradigm (later referred to as VP) as well as to provide some tips and tricks. This guide does not explain modelling different types of diagrams and principles behind them (e.g. UML activity diagram).
VP versions and license
There are two versions of Visual Paradigm that can be used for free for non-commercial use. One of them is web-based https://online.visual-paradigm.com, the other is a desktop application. Visual Paradigm Online is generally more limited, however both desktop and online versions cover all the required features for this course. The guide is written based on the desktop version.
For use on your own computer, download and install the Visual Paradigm Community Edition. It is recommended to register the software by providing either your personal or university e-mail address on first launch. The activation code will be sent as an e-mail after registration.
We will not use any features that require a paid version of the software.
Using Visual Paradigm
First up, let’s take a look at how projects are structured. After that, we’ll create a new project and create a new diagram within that project. Finally, you’ll learn how to export your diagram as an image.
VP project structure
Before you start creating diagrams, let’s understand how a VP project is structured. One project can contain multiple diagrams – e.g. it can contain multiple activity diagrams, but it could also contain other types such as state machine diagrams, sequence diagrams etc. One of the features making VP a modelling tool is that those different diagrams can have common elements that are connected to each other by the underlying model. This is a topic for later subjects however. You can recognize a VP project by its .vpp file extension.
Next up, we’ll go through an example creating one project that contains one diagram. Later on, it will be up to you to choose how you prefer to structure your projects – each diagram in a separate project or multiple diagrams within one project. In practice, these tools are designed so that one project file can contain multiple diagrams detailing various aspects of the project, including specifications etc. For the purposes of this course, it might be convenient to hold all diagrams within a single project file.
Creating a new project and a diagram
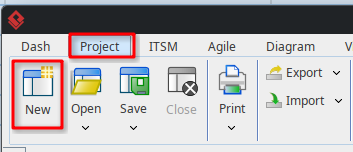
Start by creating an empty project by clicking Project -> New.
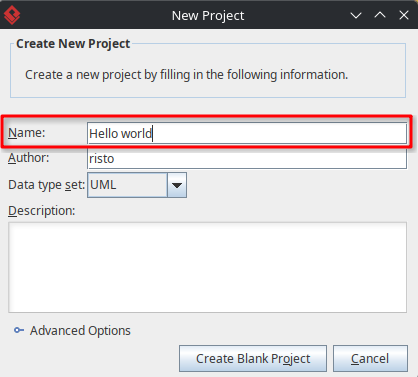
Give your project a name, optionally a description as well.
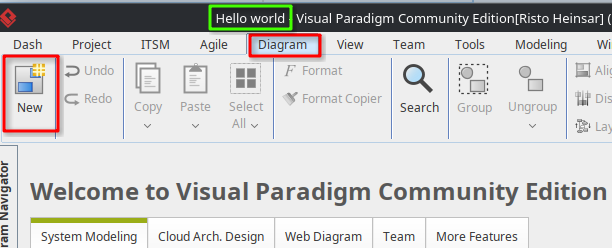
The project has been created. You should see the name of the project in the title bar (marked by a green box). Initially, the project does not contain any diagrams. Continue by adding a new diagram by clicking Diagram -> New.
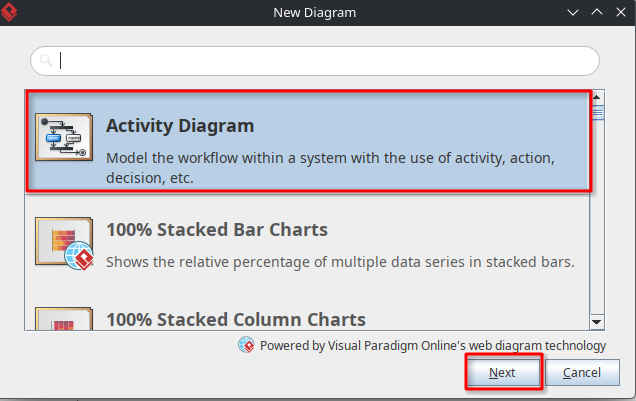
Choose Activity Diagram as the type of the diagram.
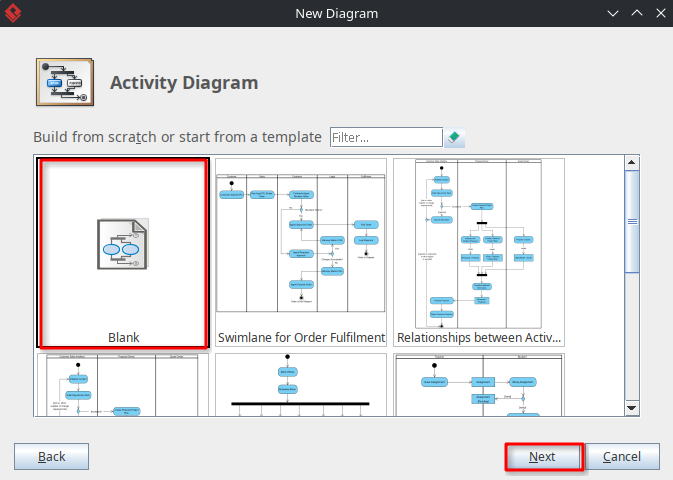
The application will show you possible example diagrams. Choose a Blank diagram. If you wish, you can explore the provided examples later.
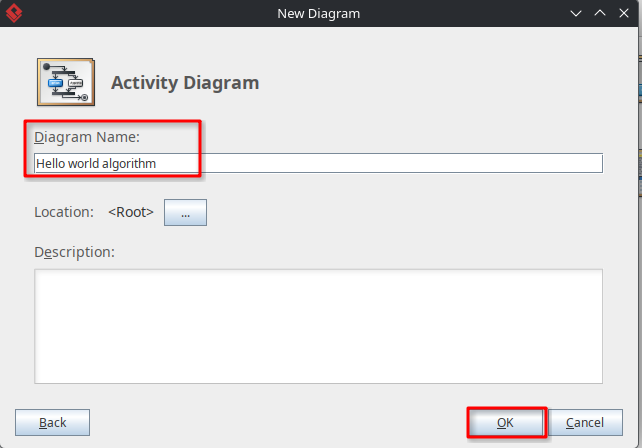
Finally, give your diagram a name. As a reminder, the diagram is not the same thing as the project – a project can contain multiple diagrams.
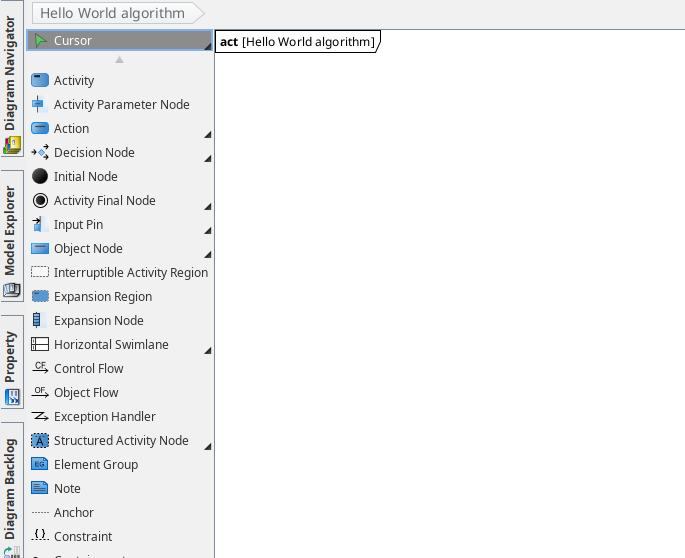
You are now greeted with the diagram view. The tools used to model the diagram are on the left. The canvas for the diagram is positioned right next to the tools. Notice that the name of the diagram and the shorthand for the diagram type (act – activity diagram) are on the top left corner of the canvas.
Multiple diagrams within a project
If you decide to have multiple diagrams within the same project, then start by opening up the project first. Once open, you can add another diagram by choosing Diagram -> New. We will not repeat these steps again in this guide.
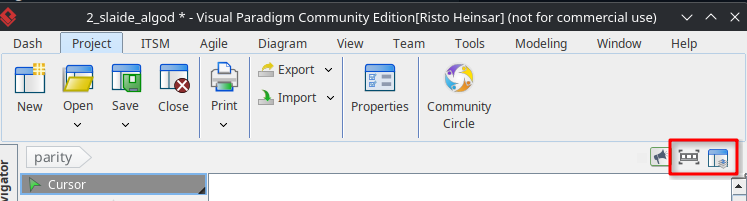
To switch between diagrams, there are two buttons on the top right side of the toolbar. The left one lets you quickly switch between open diagrams; the right one shows all diagrams within the project.
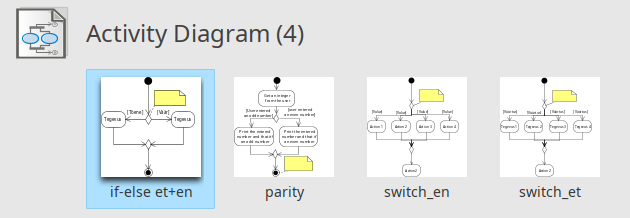
As an example, the following project contains four different activity diagrams.
Exporting a diagram as an image
In order to include your diagram in your homework report, or just to send it to a friend, you should first create an image of your diagram. Before you do that, make sure that your diagram is readable. For that, see following section below: Changing the color scheme to make diagrams easier to read.
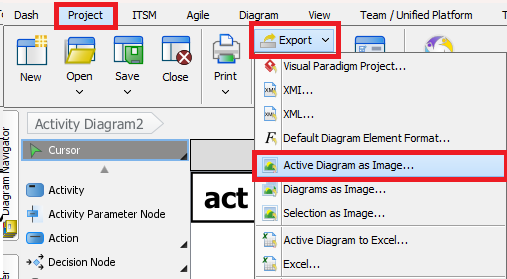
Creating an image is done by exporting (Project -> Export). In that menu, you will find two relevant options. If you want to export the diagram that’s currently active, choose Active Diagram as Image … If your project has multiple diagrams and you want to export multiple diagrams in one go, you can choose Diagrams as Image …
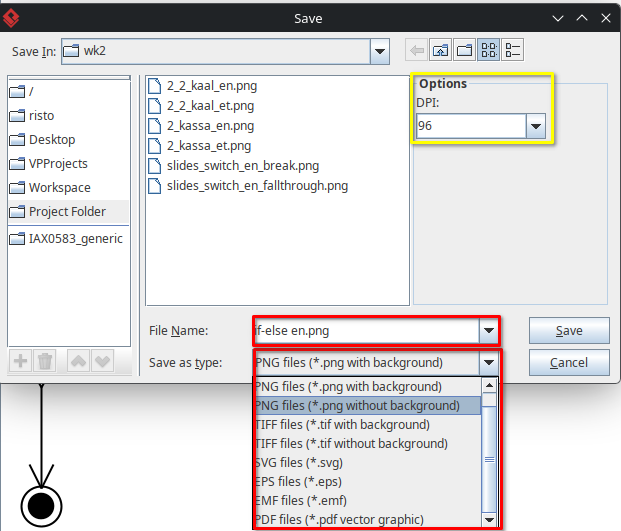
In the save dialog, specify the location, name and image type. Most of the time, exporting the image as a PNG file is the preferred option. It’s a lossless raster format that can be used in documents and presented on the screen, assuming you don’t need to enlarge the image much. For enlarging while retaining the quality, prefer using a vector graphics file type. One such format available for exporting is SVG. Additionally, when using a raster graphics file, increasing the DPI settings can be helpful – e.g. if you wish to print the image.
Useful techniques
The following chapters introduce some handy ways to improve working with VP and also to speed up your modelling.
Changing the color scheme to make diagrams easier to read
The default color scheme (black text on a blue background) can look readable on the computer screen, but the low contrast can make it hard to read on (printed) documents or when projected to a screen by a projector.
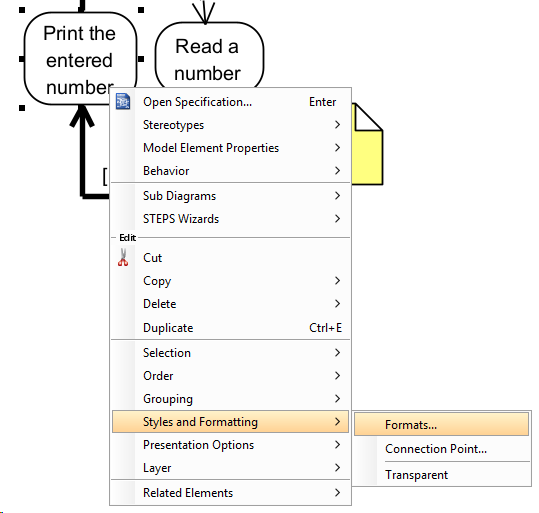
To change a color scheme, right click the desired element type and choose Styles and Formatting -> Formats…
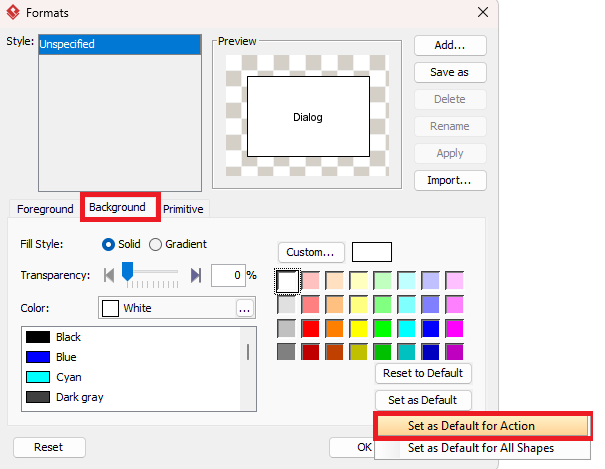
It is recommended to use white background for actions and light yellow for comments. Click on the background tab to adjust these settings. To set this style as the new default globally for this type of element, click Set as Default …. Each type of element should be adjusted separately, so repeat this for all relevant element types. Typically you wish to alter action, decision and merge nodes and comments (notes).
Copy-pasting diagram elements
The default copy-pasting (ctrl+c ctrl+v) behavior in this application is a little bit more nuanced than you might expect from your experience with other applications. First, let’s look at what actually happens when you copy-paste design elements and why. After that, let’s learn how to make independent copies of selected elements.
When you copy-paste one or more elements in a diagram, the copied elements will become references to the original element. By altering any of them, all related (copied) elements will show the altered element. There’s a reason for this. The diagram isn’t just a picture, but a collection of related elements and diagrams. Official terminology uses the term view – so by creating a copy, you are instead creating a view of the original element. An element can appear in multiple views, which can appear in different diagrams.
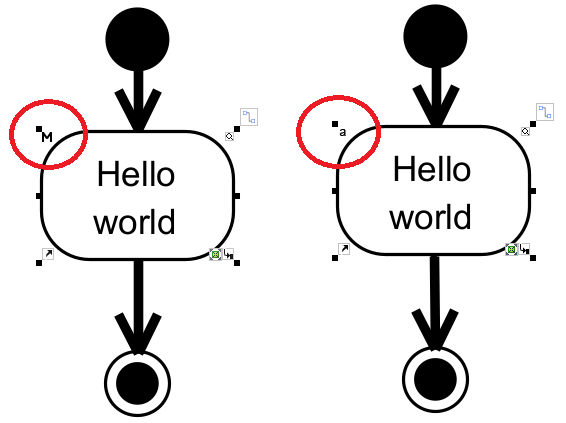
To understand if an element has multiple views, click on the element and check the upper left corner. The original element has the letter “M” referring to master view and the copied element has the character “a” for auxiliary view. Changing the element in one view will change it in all views.
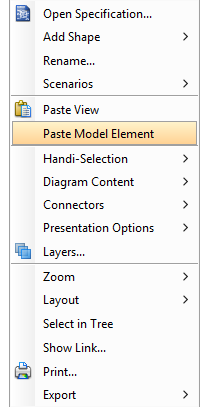
To create independent copies, make the copy as usual, however when pasting, right click on the desired location to open the context menu and choose Paste Model Element. Notice that the default paste option in the context menu is Paste View.
Layered elements
If you’ve used modeling tools or image editors, such as Photoshop, this will feel familiar to you. VP allows you to place elements on top of each other, either partially or completely covering them. Elements that are behind others can become difficult to see or select using a mouse. You’re most likely to run into this when partitioning your design using swim lanes. We recommend drawing the partitions first, then placing the elements on top afterwards – this puts the partitions behind all other diagram elements, so that are less likely to get in your way.
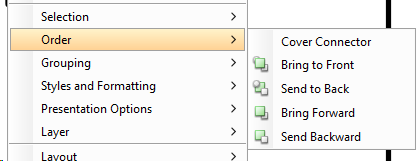
If you already have an element that’s blocking access to elements behind it, you can change their order manually. Right-click on the blocking element, use the options in the Order menu to change their ordering – e.g. send the obstructing element to the back.
Splitting control flow to insert elements in between
This is one of those things that’s easy enough to do manually – delete the existing control flow, add the required element(s) and redraw the updated control flow arrows. There is however a quicker and easier way. Let’s go through an example by fixing a common mistake in an activity diagram. Let’s model a loop that prompts the user for input until a positive number is entered.
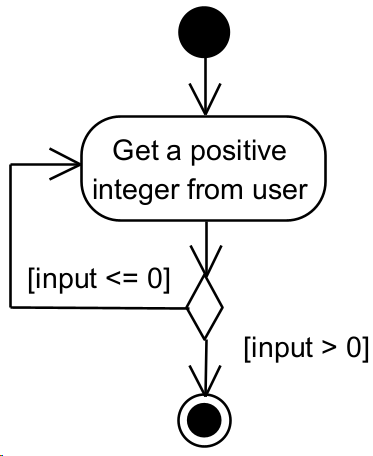
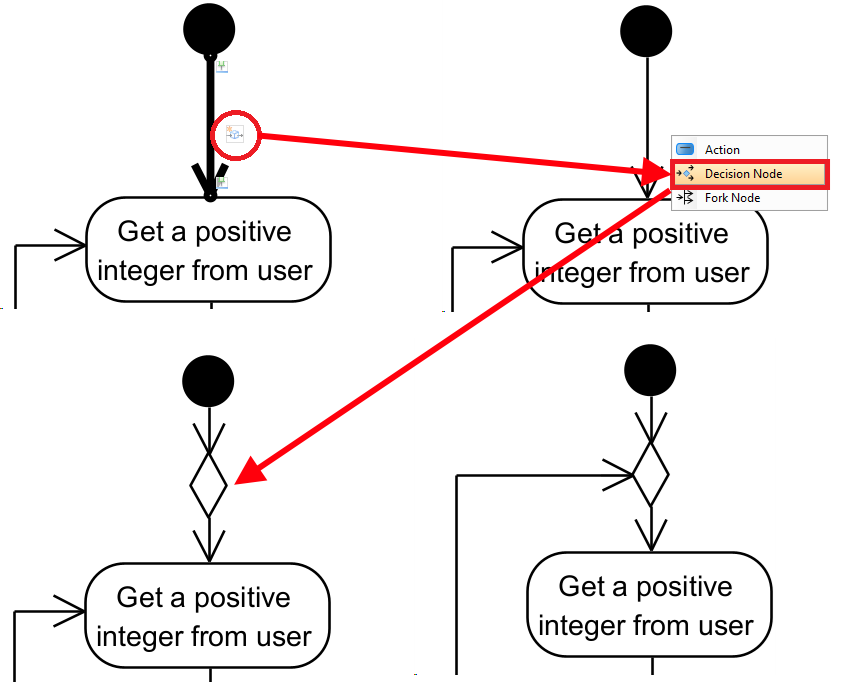
This model has a common mistake that comes up in the first weeks – missing merge node before the beginning of the loop. Since there are two alternative flows, they need to be merged by using a merge node.
Steps to fix it:
- Make some room where you wish to add a new element, in this case a merge node.
- Click the control flow you wish to split.
- Click on Split by shape (the small icon).
- Pick the symbol used to split. In the example, we select a Decision node. We actually need a merge node, but since both elements use the same diamond shape and can be identified by incoming and outgoing control flows, it will work for us. The connecting control flows are connected automatically to the added shape.
- Move the control flow coming from the end of the loop, so it connects to the merge node.