Debugger is a tool that you can use to run your code line-by-line and analyze the contents of your program. This includes the values of all variables, function call stack and so on.
These kinds of tools exist with almost all programming languages and are used regularly during development for analyzing and fixing mistakes. Most code editors already come with a debugger (e.g. CLion, Visual Studio) or they can be “attached” to them (e.g. Geany, Visual Studio Code). Quite often the debuggers themselves are actually separate programs (e.g. GDB – GNU debugger) for which the code editor just provides a front end.
This is exactly how the debugger in Geany works. We will install and enable a plugin that will be a front-end to a command line based debugger called GDB.
Setup
Before you can use the debugger, you need to perform a few one-time actions to set it up. The setup is only required on your own computer. Lab computers are already preconfigured.
Installing the Geany plugin
If you followed our Geany installation guide you should already have everything installed and you can skip this part (go directly to activating the debugger)
If not, then install geany-plugin-debugger. When using any of the Ubuntu based distributions, you can do it by running the following command:
|
1 |
sudo apt install geany-plugin-debugger |
You can also install all the other available plugins. Just replace the name with geany-plugins , which will contain all of them nicely packed together..
Activating the Geany plugin
Note: this is also preconfigured on the lab computers.
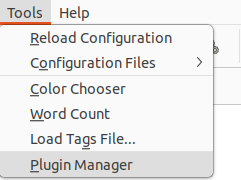
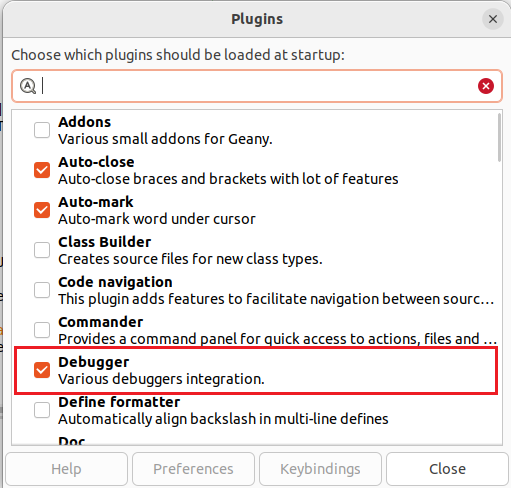
To activate, inside Geany go to the following menu Tools -> Plugins.
Find Debugger in the list and tick the box to enable it.
Configuring the compiler
Note: this is also preconfigured on the lab computers.
To allow the debugger to work, we need to instruct the compiler to provide it additional assistance by adding a flag -g . This flag will add information to the compiled program that is necessary for debugging. Your program will get bigger and slower, but it will allow us to use debuggers and various software analysis tools. You do not want this flag on when shipping to clients!
Note: The same can be done by choosing Build -> Set build commands in the menu, but then you will need to have a .c code file open in Geany or it will not work. The guide below is written in a way that it is not necessary .
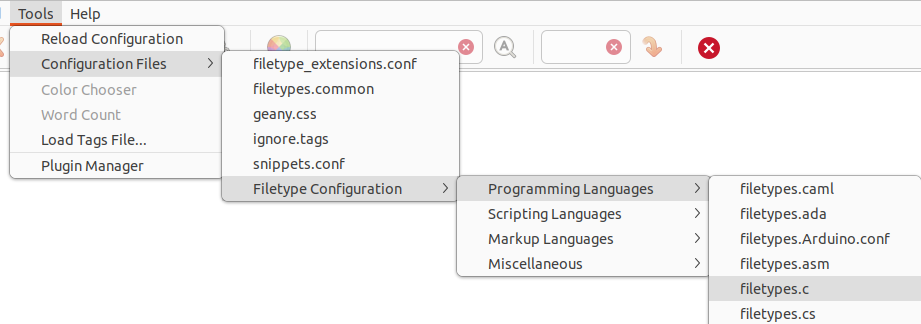
Open the configuration file for C code files: Tools -> Configuration files -> Filetype Configuration -> Programming Languages -> filetypes.c
In the configuration file, you need to add the compilation flag -g to the line FT_01_FM. It is underlined with red in the figure below. Make sure to have spaces before and after. The argument cannot be placed after the argument -o .
This is an example of my configuration file after adding the compile flag (red underline for the added argument).
If you want to copy-paste it, you can do it from the box below. Note that I’m also using flags -Wextra and -Wconversion for additional information on potential bugs when compiling (you can remove them if you wish to do so).
|
1 2 3 4 |
[build-menu] FT_01_LB=_Build FT_01_CM=gcc -g -Wall -Wextra -Wconversion -o "%e" "%f" -lm FT_01_WD= |
Setting up hotkeys
Unfortunately you likely don’t have an idea what to do with this paragraph yet. However you should return here after you have tried the debugger out at least a few times to know what you are looking at.
By default, the debugger has no preset shortcuts (e.g. if you press F5, the program will run without the debugger as it did before). You will likely want to assign some keyboard shortcuts to directly launch and interact with the debugger. To do so, choose Edit -> Preferences in the menus. Choose the tab Keybindings and scroll until you see the Debugger partition. Here you can add shortcuts of your choosing.
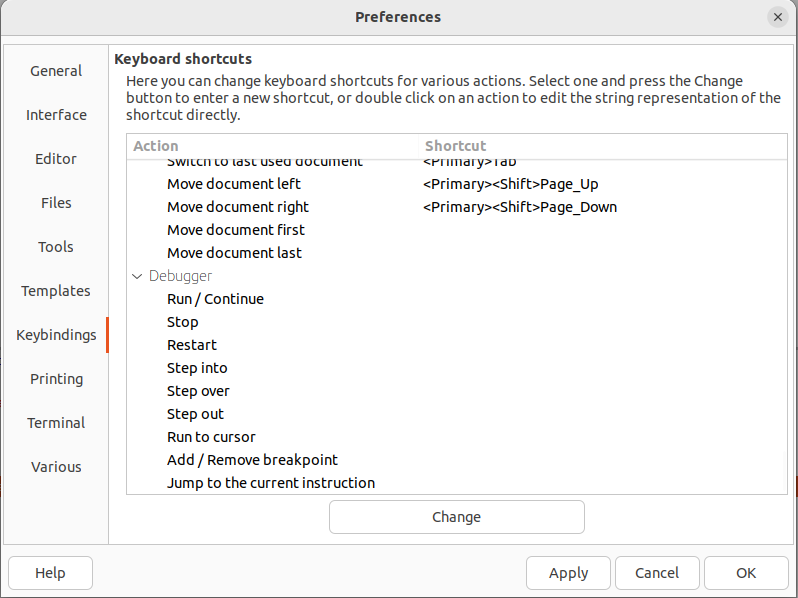 Some of the ones you might be interested in are Run / Continue, Step into, Step over, Step out, Run to cursor etc.
User interface
After enabling the plugin, you will get a new tab called Debug. By opening it, you should be looking at the following:
Highlighted areas:
1 – The program under debugging should be specified into Target. You need to update this every time you are debugging a new program. You can specify command line arguments below it.
2 – This contains the controls of the program – run, stop, stepping through etc.
3. These are the various informational views of the program
- Target describes the program, command line arguments and the environment
- Breakpoints allows you to see and toggle on which lines in which files your code will stop.
- Autos will show you the variables that are currently in scope (e.g. local variables in a function).
- Watch allows you to add things you want to always see. You can add a variable from Autos by double-clicking it or write what you want to see manually.
- Call stack shows you the function call stack starting from main. It will also show threads in a multithreaded programs.
- Debug terminal is your normal terminal window. You can also input through here.
- Debugger Messages is the output of GDB.
4 -I’ve highlighted this button because it allows you to split the debugger window into 2 tabs. It is important since it allows you to comfortably observe the output and variable values at the same time. Otherwise they are in different tabs and you need to click through them constantly.
The alternative UI it provides looks the following:
Debugging a program
Before we start debugging, let’s make sure we are more familiar with the user interface and know where to look for things.
Code used in the sample below: https://blue.pri.ee/ttu/files/iax0584/demokood/demo_debugger.c
1. Choose the program you are debugging
First step for debugging any program is to set the location of the program you are about to debug. The debugger does not automatically try to debug the file that is currently open. Typically a program consists of a lot of code files and the debugger does not know the starting point nor what is the output name of your program.
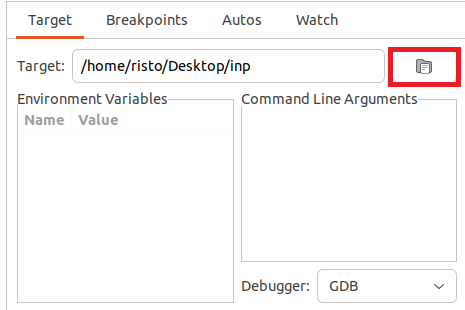
Go to the Target tab and click Browse. Find and select the program you are about to debug. The location of it will appear in the textbox next to the target (.c files are not programs!)
You can also add environment variables and command line arguments here.
2. Choose your breakpoints
Secondly, we need to choose our breakpoint or breakpoints where we want to program to stop. You can add multiple breakpoints in one file and you can add them in multiple files at the same time. After you start your program, it will run until it reaches the first breakpoint and then goes over to the debugging mode.
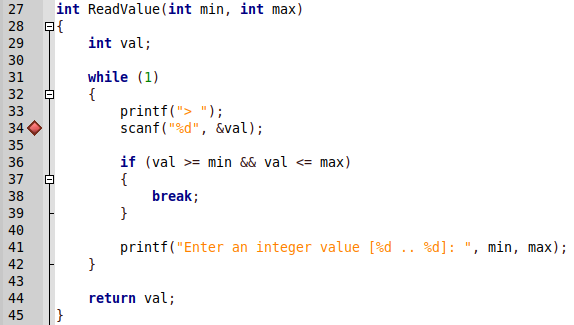
Easiest way to do so is to click next to the line number with your mouse. A red dot will appear to signify a breakpoint. In this program, it is stopped on line 34.
You can also specify and toggle breakpoints by hotkeys.
3. Start your program in the debugger
Look for the debugger controls on the right side of the debugging window. Click Run to start the debugger. To stop it, click the Stop button.
After you start, the debugger will run until the first breakpoint (or where it may need user input). In a two-pane view, you will have the information of the program on the left and the terminal on the right.
Our demo program stopped at user input. It has not yet reached our breakpoint! It will be reached after completing the scanf statement. This means we need to give some input in the terminal.
Once the input is entered, the program stops again. This time it’s because of reaching a breakpoint. Looking at the Autos tab on the left pane, you will see the local variables of the function. On the right side, all the debugger controls for stepping through the program also unlocked.
4. Stepping through the program
Once the program reaches a breakpoint, you can control the program flow step by step. For this, you have the control buttons on the right:
- Continue – program runs normally until it reaches the next breakpoint. If necessary, it will stop to ask for user input, however debugging mode will only continue when you reach a breakpoint.
- Restart – restart the program
- Stop – stop the program
- Step over – Steps over a function call. The function itself will be executed normally, however the debugger will not enter it so you don’t have step-by-step controls inside of the function.
- Step into – Steps into the function being called – this allows you to strep through the entire function that was called, step by step. Do not use this for standard library functions (e.g. printf, scanf).
- Step out – Steps out of the current function (to after it returns) and continues the debugging from where the function was called.
- Run to cursor -In the code window, you can click on a new location where the program will stop. Until that point, the program will go back to normal mode. This is basically an automatically added temporary breakpoint.
NB! If your program encounters another breakpoint before this, it will stop there.
Heads up! Printing in the terminal is a buffered operation. The output of every printf statement will not be immediately visible after it’s being called, but rather either once the buffer is manually flushed, fills up or the end of the line is reached.
Hovering over variables
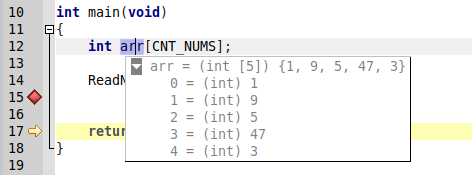
When we are in the debugging mode, we can hover over any variable or function with our mouse that is in scope. This allows us to immediately see the value a certain variable is holding at that time.
Watch list
In order to keep track of certain variables all the time, you can add them to the watch list. You can add things there in two different ways:
- In the autos tab, you can double-click the variable you wish to add to Watch.
- In the Watch tab, you can click on the empty line after the last entry and write the variable or expression you wish to observe.
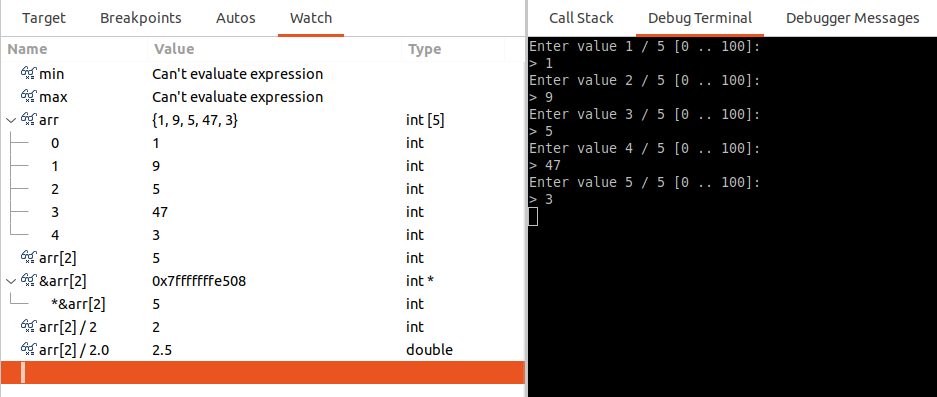
In the example above, we have stopped the program in the main() function, after reading the array values. You can see that the parameters min and max for ReadValue() are not readable – we can only read variables in scope.
We can add additional data points not automatically added to Autos. In this example, we have added
- The array with all its members
- A single member of the array
- A memory address to a single member of the array (including which it is pointing at)
- Some mathematical operations with the resulting values
To see array contents that has been passed to a function, add it manually to the watch list using the following format: *arrayName@length
NB! You cannot add names of macros. Just as a reminder, macros are replaced during compilation with constants, so they are no longer present in the compiled code.
Debugging command line arguments
To use command line arguments in the program being debugged, specify them in the Target tab under Command Line Arguments.
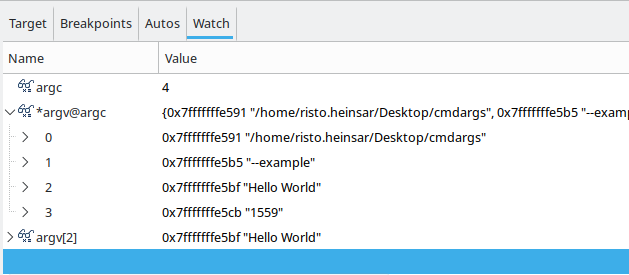
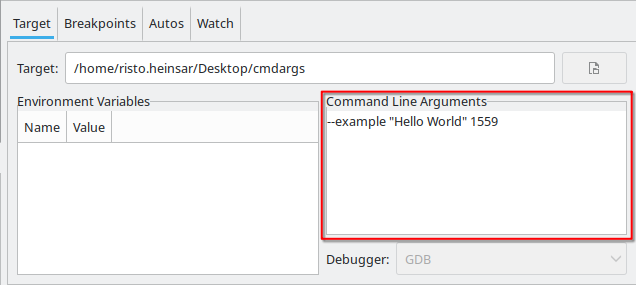 While the autos tab is able to easily detect
argc , it only shows a pointer to
argv and the first argument (
argv[0] ). To have a better overview of the arguments, add them to a watchlist. To see all of the arguments, we use the previously introduced pattern of
arrayName@arrayLength .
Windows
The version of the debugger used in this guide is now available for Windows. Still, it is possible for Windows users to a different debugger plugin for Geany, which is relatively similar. This version has a few extra nice features, but also some disadvantages. The differences for our purpose will be minor and rather irrelevant.
Note: this debugger can also be used in Linux, however it is not preconfigured in the lab computers.
The usage of this debugger is relatively similar to the one described before, so I’ll only highlight the main differences.
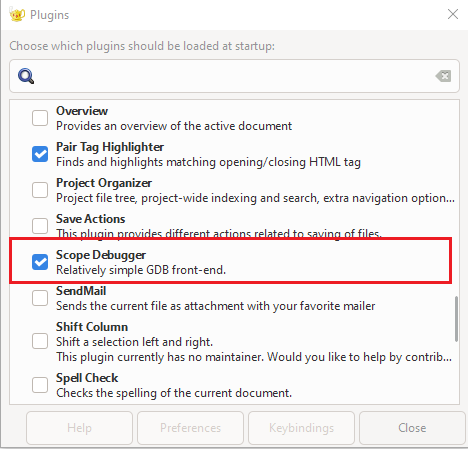
The name of the plugin to enable is Scope Debugger
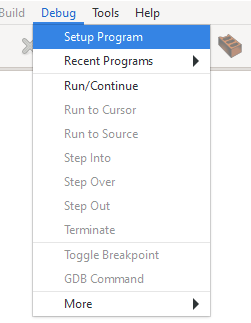
To set up the program, you need to go to the menu Debug -> Setup. Select the program you are about to debug and press OK.
The stepping through the program is done by using a new set of icons that appeared on the top toolbar. To add / remove a breakpoint, you need to click on the blue button on the toolbar. The rest of the buttons are for controlling your program in the debugger and stepping through it.
